 |
 |
Thursday 20 Dec: State Population Estimates to be released
Poll
| No votes (0%) | |||
| 2 votes (100%) | |||
| No votes (0%) |
2 members have voted
| December 14th, 2012 at 7:31:58 PM permalink | ||||||||||||||||||||||||||||||||||
| Pacomartin Member since: Oct 24, 2012 Threads: 1068 Posts: 12569 | The United States saw its population increase between April 1, 2010, and July 1, 2011, was the lowest since the mid-1940s. The population increase of 6,140 per day was 20% lower than 7,593 per day of the previous year. The day when the population reaches 400 million has been pushed back from 2042 to 2051. The only three states to lose population between April 1, 2010, and July 1, 2011, were Rhode Island (1,300 or -0.12 percent), Michigan (7,400 or -0.08 percent) and Maine (200 or -0.01 percent). Nevada, the nation's fastest-growing state between 2000 and 2010, ranked only 27th in population growth between April 1, 2010, and July 1, 2011, increasing by 0.8 percent. During the 1930's a record of six states lost population as large numbers of people left the midwest and Oklahoma in search of better employment opportunities.Nationwide population increase averaged 2,435 per day as foreign immigration and births dropped to record lows. In the last decade only Michigan lost population as the mass exodus from Detroit began. When the estimates are released next week, will we see another new low?
| |||||||||||||||||||||||||||||||||
| December 16th, 2012 at 4:17:46 AM permalink | |
| 98Clubs Member since: Nov 11, 2012 Threads: 2 Posts: 75 |
Dustbowl era. There are four things certain in life... Death, Taxes, the Resistance to them, and Stupidity. |
| December 16th, 2012 at 6:38:52 AM permalink | |
| Pacomartin Member since: Oct 24, 2012 Threads: 1068 Posts: 12569 |
In the Dustbowl era it was the first and only time that 6 different states lost population over a ten year period. California had the biggest population gain of any state in the country (it gained the equivalent of the entire population of North and South Dakota). "The Grapes of Wrath" documents the move to California and the beginnings of labor organization. -4.3% Kansas -79,971 -4.5% Nebraska -62,129 -2.5% Oklahoma -59,606 -7.2% South Dakota -49,888 -5.7% North Dakota -38,910 -0.1% Vermont -380 Nowadays, Rhode Island has the lowest fertility rate of any state in the union. It's TFR is well below sustainability. So without immigration it begins to lose population. But so far it has just been RI, Maine, and Michigan in the year 2011. The question is will other states join the list. |
| December 16th, 2012 at 7:01:00 AM permalink | |
| AZDuffman Member since: Oct 24, 2012 Threads: 135 Posts: 18210 |
Sooner or later some might. I can see in about 10 years some states getting a "dying off" problem. As populations get older and economies do not grow people will just not move there. How many towns have you visited and asked, "why on earth is this town here" when it has no factories, mines, or other anchor that might have caused people to settle and sustain themselves. IMHO sooner or later water will play a role, with the Great Lakes areas becoming more viable again. But it will not rebuild Detroit. Some places are beyond saving in this lifetime. The President is a fink. |
| December 16th, 2012 at 11:35:27 AM permalink | |
| Pacomartin Member since: Oct 24, 2012 Threads: 1068 Posts: 12569 |
Russia may be indicative. Russia went into negative growth around the same time as the USSR collapsed. The death rate soared as alcoholism, despair, violence, and malnutrition took over. Now 20 years later, the death rate is calming down, and birth rates are returning to a level that might sustain ZPG. There is some immigration not shown on this graph as some people from former USSR satellites did move to Russia in search of economic opportunity. 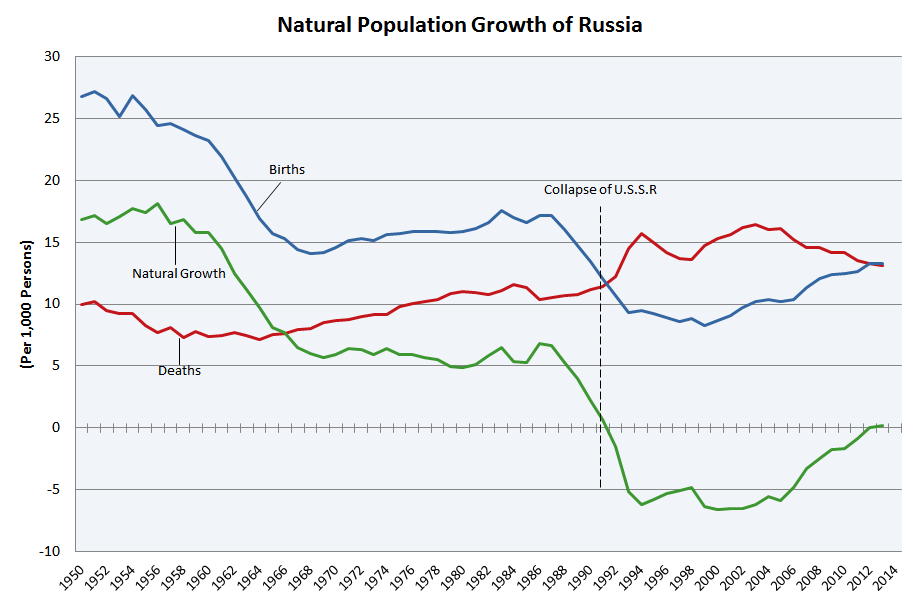 To pick a closer decade than the Great Depression, in the 1980's four state's lost population, (Iowa,North Dakota, West Virginia, and Wyoming). I am not counting District of Columbia which, like most Eastern Cities, lost population steadily since WWII until recently. The most sever population losses incurred were in Nevada which had a great deal of trouble establishing a population from statehood in the Civil War era until 1931 when it legalized gambling. Since then , as almost everyone knows, it has experienced some of the greatest population growth numbers of any state. |
| December 16th, 2012 at 12:35:55 PM permalink | |
| AZDuffman Member since: Oct 24, 2012 Threads: 135 Posts: 18210 |
Interesting graph, I heard about the disaster that was the Russian population in the late 1990s, they were losing about 4,000 people per day. Collapsing birth rate and well over 50% of pregnacies ended in abortion. Putin was keenly aware of the problem, looks like some of his measures helped. There is still a huge female/male gap there, one of the few places men are short women. I still see some long-term problems for them in the east, several places there are only inhabited because of forced moves under Stalin. Some places on earth were just not made to be lived in year-round. The President is a fink. |
| December 20th, 2012 at 7:54:47 AM permalink | |
| Pacomartin Member since: Oct 24, 2012 Threads: 1068 Posts: 12569 |
Population growth for the entire USA went up very slightly this year to 6,369 per day, from 0.73% last year to 0.75% this year (1 July-1 July). Rank of the states hasn't changed dramatically. The Census Bureau develops state population estimates by measuring population change since the most recent census. The Census Bureau uses births, deaths, administrative records and survey data to develop estimates of population.Components of growth (domestic and foreign immigration, births and deaths) were not released. As always, growth in the Northeast and Midwest was much lower than the South and the West. Non Hispanic White (NHW) in the Northeast have been decreasing since 1970. As usual, over half the population increase was in five states. .Texas 427,425 .California 357,497 .Florida 235,306 .Georgia 107,485 .North Carolina 100,970 This year Last year -0.09% +0.11% .Vermont Northeast -0.03% -0.20% .Rhode Island Northeast 0.03% +0.05% .West Virginia 0.03% +0.02% .Ohio 0.05% +0.07% .Maine Northeast 0.07% -0.01% .Michigan 0.10% 0.28% .Connecticut Northeast 0.12% 0.15% .Illinois 0.15% 0.26% .Pennsylvania Northeast 0.22% 0.22% .Missouri 0.22% 0.07% .New Hampshire Northeast 0.25% 0.28% .Mississippi 0.29% 0.36% .Wisconsin 0.31% 0.46% .Kentucky 0.32% 0.41% .Indiana 0.33% 0.45% .Iowa 0.33% 0.67% .New Mexico 0.34% 0.36% .New Jersey Northeast 0.35% 0.53% .New York Northeast 0.36% 0.54% .Arkansas 0.38% 0.40% .Alabama 0.54% 0.40% .Kansas 0.59% 0.67% .Massachusetts Northeast 0.59% 0.67% .Louisiana 0.60% 0.69% .Minnesota 0.72% 0.69% .Nebraska 0.75% 0.70% .Montana 0.76% 0.83% .Idaho 0.77% 0.89% .Maryland 0.80% 0.78% .Oregon 0.81% 0.66% .Oklahoma 0.88% 0.68% .Tennessee 0.95% 0.94% .California 0.99% 0.92% .Delaware 1.01% 0.99% .Virginia 1.03% 1.02% .Hawaii 1.05% 0.96% .North Carolina 1.05% 1.37% .Alaska 1.08% 0.81% .South Carolina 1.08% 1.18% .Washington 1.10% 1.01% .Georgia 1.19% 0.90% .South Dakota 1.23% 1.25% .Florida 1.33% 0.88% .Arizona 1.39% 1.34% .Colorado 1.43% 0.60% .Nevada 1.45% 1.41% .Utah 1.60% 0.53% .Wyoming 1.67% 1.54% .Texas 2.15% 2.32% .District of Columbia 2.17% 1.54% .North Dakota |