 |
 |
Cash is King!
| February 17th, 2016 at 6:04:31 AM permalink | ||||||||||||||||||||||||||||||||||||||||||||||||||||||||||||||||||||||||||||||||||||||||||||||||||||||||||||||||||||||||||||||||||||||||||||||||||||||||||||||||||
| Pacomartin Member since: Oct 24, 2012 Threads: 1068 Posts: 12569 | I did find some interesting data regarding the use of cash in principal currencies around the world. The data spanned a five year period 2010-2014. The most reported metric is the percentage of banknotes and coins relative to the GDP of the country. Then the value of the currency (per capita) expressed in US dollars at exchange rate. There is no purchasing power adjustment. So while India has a higher percentage of it's GDP in cash than Switzerland, the dollar amount is very low. Then there is the five year change in these values expressed in percentage. Japan's largest banknote is worth roughly $80 at present. They are circulating an incredible 74 pieces per person. Asia is as much or more dependent on cash as Europe, but they have traditionally worried about counterfeits. So they shy away from very large denominations. The end result is often shoeboxes full of cash. Singapore is the exception in Asia as they have a ten thousand dollar banknote which is worth $7000, but they are circulating only 200,000 of them. They are also circulating almost 14 million 1000SGD banknotes worth $700, or slightly more than the 500EURO banknote. 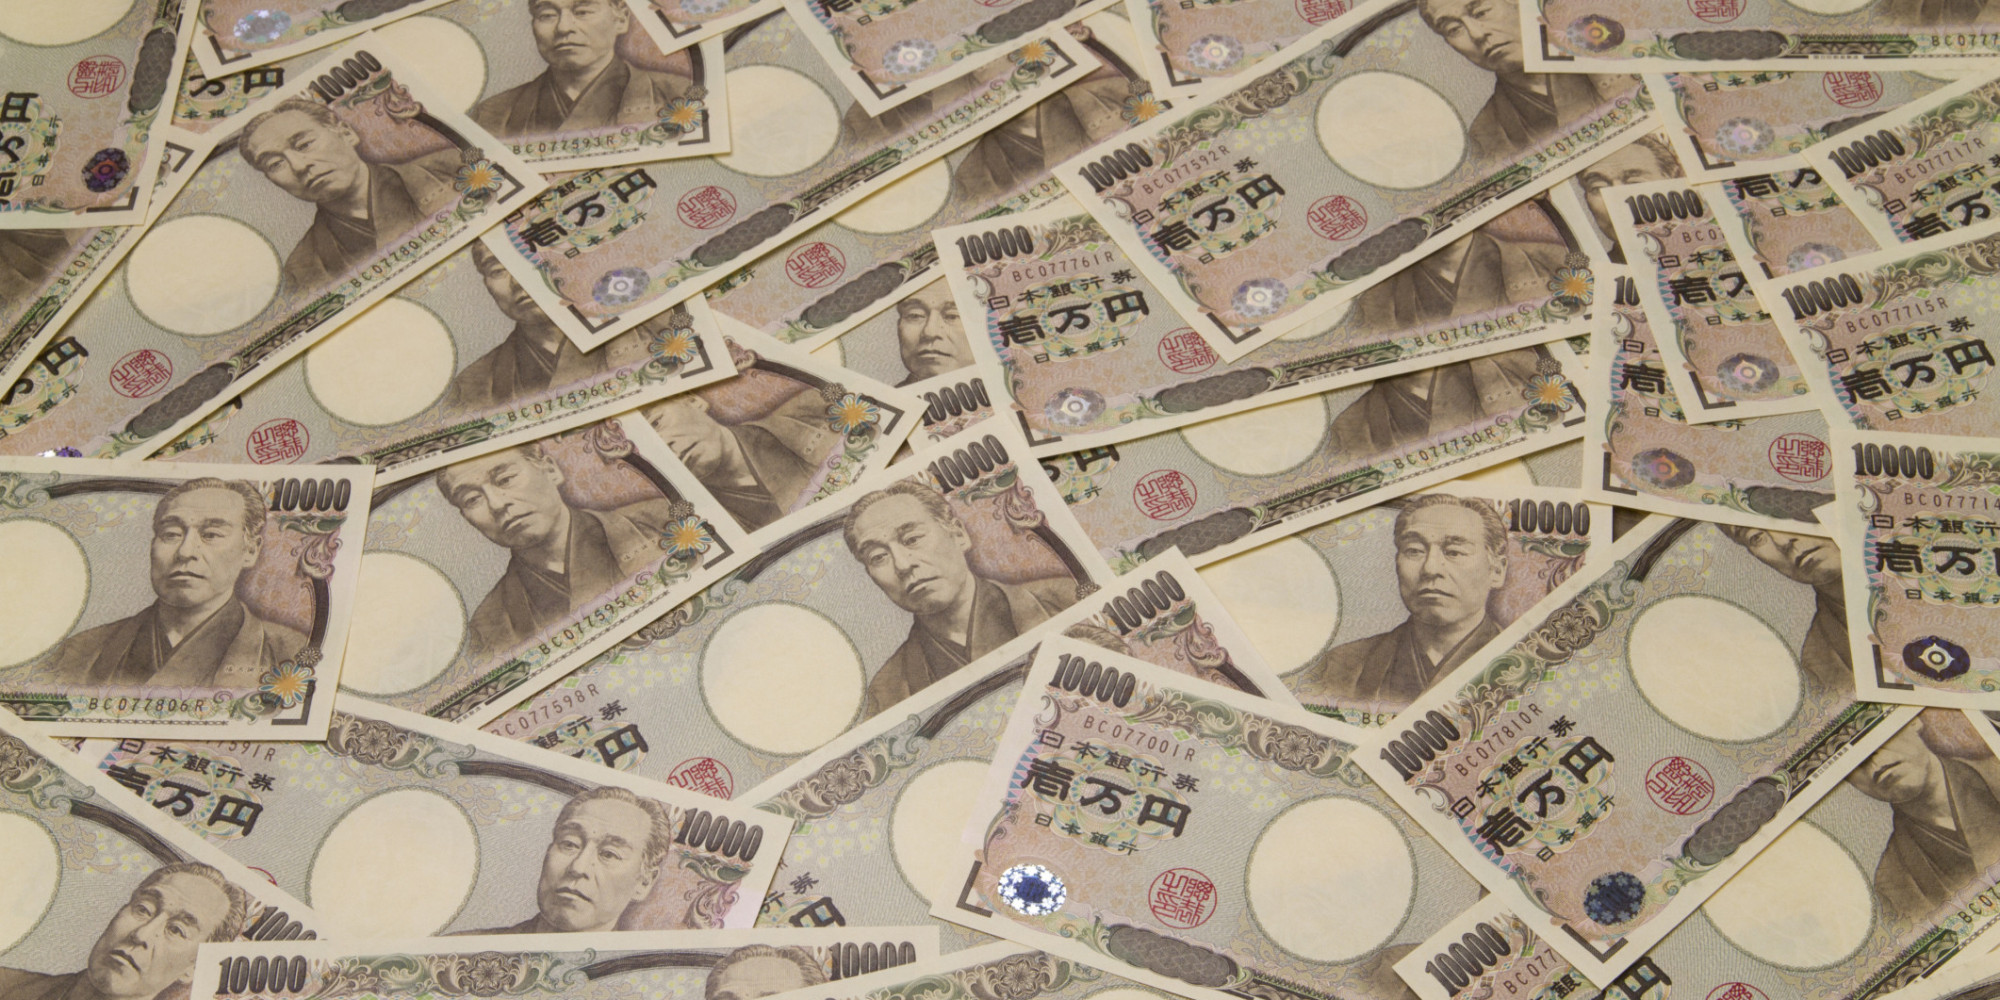 UK has always avoided large value banknotes since WWII. Sweden is a standout even among the other major Scandinavian countries in it's drive to nearly eliminate cash. In 2015 they dropped the value of their currency another 12% measured in Swedish crowns. Iceland (population around 1/3 million) formed their central bank in 1961 and started out issuing currency at close to 5% of GDP. But their currency was inflation ravaged, and they dropped two zeros by 1981. By the mid 1980's currency was at around 1% of GDP and remained that way until the banks all crashed in about 2007-2008. While possibly holding the record for the least amount of currency relative to GDP, it happened mostly through inflation. Sweden is unique in the world because of their efforts to reduce cash to record lows (as of 2014 they are at 2.12% of GDP).
 A taxing woman is an excellent Japanese romantic comedy which hinges on the Japanese obsession with avoiding taxes | |||||||||||||||||||||||||||||||||||||||||||||||||||||||||||||||||||||||||||||||||||||||||||||||||||||||||||||||||||||||||||||||||||||||||||||||||||||||||||||||||